




Chapter 8IMAT Biology
Mendel’s Experiments and Heredity
Gregor Mendel was an Austrian monk and scientist who is known as the “father of modern genetics.” He is famous for his experiments on heredity, which he conducted with pea plants in the mid-1800s.
Mendel's experiments were designed to investigate how traits, such as flower color and seed shape, are inherited from one generation to the next. He began by carefully selecting pea plants that had a particular trait, such as round seeds, and crossbreeding them with plants that had the opposite trait, such as wrinkled seeds.
Mendel then recorded the traits of the offspring and found that, in many cases, the traits of the offspring were not a blend of the traits of the parent plants. For example, if he crossbred a plant with round seeds with a plant with wrinkled seeds, the offspring would have round seeds.
This led Mendel to conclude that traits are determined by “factors,” which we now know as genes. He also discovered that these factors come in pairs, and that one factor from each pair is inherited from each parent. This is known as the principle of segregation.
Mendel's work laid the foundation for the modern science of genetics and has had a profound impact on our understanding of heredity. Today, his principles are still widely accepted and have helped scientists make important discoveries about the genetic basis of inherited traits and diseases.
Section 8.1
Phenotypes and Genotypes
Phenotypes and genotypes are fundamental concepts in genetics, which help us understand the relationship between an organism's physical traits and its underlying genetic information.
A phenotype encompasses the observable characteristics or traits of an organism, including both external features (such as eye color, hair color, and height) and internal aspects (such as blood type and metabolic processes). Phenotypes result from the interaction between an organism's genotype and its environment, which can influence the expression of certain traits.
A genotype, on the other hand, is the complete set of genetic information within an organism's DNA, including all its genes and alleles. An organism's genotype serves as a blueprint for the development and function of its various traits. Genes are segments of DNA that code for specific proteins or functional RNA molecules, which contribute to the formation and regulation of an organism's traits.
Alleles are different versions of a gene that arise from mutations or variations in the DNA sequence. Each individual inherits two alleles for each gene, one from each parent. The combination of these alleles determines the individual's genotype for a particular trait.
The relationship between genotype and phenotype can be understood through the principles of dominant and recessive inheritance, as illustrated by the example of eye color:
- Dominant and Recessive Alleles: Alleles can be dominant or recessive, which affects their expression in the phenotype. Dominant alleles are expressed even when only one copy is present (heterozygous), while recessive alleles are only expressed when two copies are present (homozygous).
- Inheritance Patterns: The inheritance of alleles follows Mendel's laws of segregation and independent assortment. Segregation states that each parent contributes one allele for each gene to their offspring, while independent assortment states that the inheritance of one gene does not affect the inheritance of another.
Using the eye color example, let's assume the brown eye allele (B) is dominant, and the blue eye allele (b) is recessive. There are three possible genotypes for eye color:
- Homozygous dominant (BB): Brown eyes
- Heterozygous (Bb): Brown eyes, as the dominant brown allele is expressed
- Homozygous recessive (bb): Blue eyes
Understanding phenotypes and genotypes is crucial for various applications, including predicting the risk of genetic diseases, guiding selective breeding in agriculture, and contributing to personalized medicine. By studying the relationship between phenotypes and genotypes, researchers can identify the genetic basis of inherited traits, understand how they are transmitted through generations, and develop strategies to prevent or treat genetic disorders.
Section 8.2
Sex-Linked Disorders
Sex-linked disorders are genetic conditions that arise due to mutations in genes located on the sex (X and Y). Understanding how these disorders are inherited and analyzing related questions on the IMAT requires a good grasp of the concepts of sex-linked inheritance and pedigree analysis. In order to analyze sex-linked related disorders, it's essential to understand the basics of sex chromosomes, inheritance patterns, and specific examples of sex-linked disorders. We will start by discussing the foundational concepts and then move on to examples and strategies for tackling such questions on an exam.
- Basics of sex chromosomes: Humans have 23 pairs of chromosomes, with one pair being the sex chromosomes, X and Y. Females have two X chromosomes (XX), while males have one X and one Y chromosome (XY). Genes located on these sex chromosomes are responsible for sex-linked traits and disorders.
- Inheritance patterns: Sex-linked disorders can be either X-linked or Y-linked, depending on the chromosome where the mutation occurs. X-linked disorders are more common and can be either dominant or recessive. Y-linked disorders, on the other hand, are rare and always dominant since males have only one Y chromosome.
- X-linked disorders: These disorders are caused by mutations in genes located on the X chromosome. Males are more likely to be affected by X-linked disorders because they have only one X chromosome, and any mutation on that chromosome will be expressed.
- X-linked recessive: In this case, a female with two copies of the mutant allele will be affected, while a female with one copy will be a carrier. Males with the mutant allele will always be affected. Examples include hemophilia and Duchenne muscular dystrophy.
- X-linked dominant: In this case, a female with at least one copy of the mutant allele will be affected, while males with the mutant allele will also be affected. Examples include Rett syndrome and fragile X syndrome.
- Y-linked disorders: These are rare genetic disorders caused by mutations on the Y chromosome. Since males have only one Y chromosome, Y-linked disorders are always dominant and exclusively affect males. Examples include Y-linked hearing loss and some cases of male infertility.
Now that we have covered the basics, let's discuss how to approach sex-linked disorder questions on an exam:
- Determine the type of disorder: Identify if the disorder is X-linked or Y-linked, and if it is dominant or recessive. This information is crucial for understanding the inheritance pattern and predicting the likelihood of an individual being affected or being a carrier.
- Analyze the given information: Carefully read the question and understand the family history or pedigree provided. Note the affected individuals and their relationships to one another.
- Apply the inheritance pattern: Using the information about the disorder and the given family history, apply the inheritance pattern to predict the chances of an individual being affected, being a carrier, or passing the disorder to their offspring.
Example: A question about an X-linked recessive disorder, like color blindness:
Given: A woman with normal color vision (unaffected) has a father who is colorblind. She marries a man with normal color vision. What is the probability that their children will be colorblind?
Solution:
- Determine the type of disorder: Color blindness is an X-linked recessive disorder.
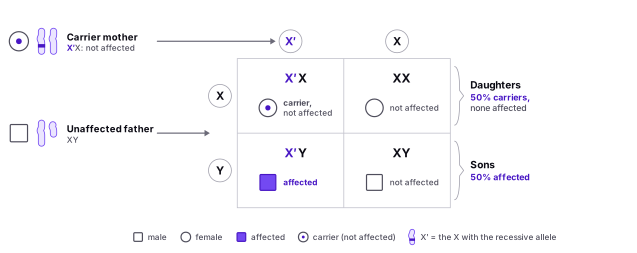
- Analyze the given information: The woman's father is colorblind, meaning she must be a carrier (X'X) since she has normal color vision. Her husband has normal color vision (XY). (Note: the ' in this case is to denote the affected chromosome)
- Apply the inheritance pattern: Since the woman is a carrier, there is a 50 chance she will pass on the affected X chromosome (X') to her children. If she has a son (XY), there's a 50 percent chance he will inherit the affected X chromosome and be colorblind (X'Y). If she has a daughter (XX), there's a 50 percent chance the daughter will be a carrier like her mother (X'X).
In conclusion, understanding the basics of sex chromosomes, inheritance patterns, and specific sex-linked disorders is crucial for analyzing questions related to these topics.
Find it in the figure
Coming soon for figure 8.1
Section 8.3
Mendelian Genetics
According to Mendelian genetics, there are three main modes of inheritance: dominant, recessive, and co-dominant.
Dominant inheritance: In this mode of inheritance, a single copy of the dominant allele is sufficient to express the trait. The dominant allele is usually represented by an uppercase letter, while the recessive allele is denoted by a lowercase letter. In a heterozygous individual (having two different alleles for a gene), the dominant allele masks the expression of the recessive allele.
Example: Huntington's disease is a dominant genetic disorder caused by a single dominant allele (H). An individual with one copy of the dominant allele (Hh) will develop the disease, while a person with two recessive alleles (hh) will not.
Recessive inheritance: Recessive traits require two copies of the recessive allele for the trait to be expressed. If an individual carries only one recessive allele, they are considered a carrier and do not exhibit the trait. Recessive disorders are often inherited from carrier parents.
Example: Cystic fibrosis is a recessive genetic disorder caused by two copies of the recessive allele (f). An individual with two copies of the recessive allele (ff) will have the disease, while a person with one dominant and one recessive allele (Ff) will be a carrier but not affected.
Co-dominant inheritance: In co-dominant inheritance, both alleles are expressed equally, and both contribute to the phenotype. This results in a unique phenotype that is distinct from the homozygous dominant or homozygous recessive state.
Example: Human blood types A, B, and O are determined by three alleles: IA, IB, and i (O). The IA and IB alleles are co-dominant, while the i (O) allele is recessive. An individual with one IA and one IB allele will have blood type AB, as both alleles are expressed. An individual with two i (O) alleles will have blood type O, while an individual with two IA alleles will have blood type A.
The Punnett Square
The Punnett square is a tool used in genetics to predict the possible outcomes of a genetic cross or breeding experiment. It is named after Reginald Punnett, who developed the concept in the early 1900s.
In summary, to use a Punnett square, you need to know the genotypes of the parent organisms. The genotypes are represented by letters, with each letter representing a specific allele. For example, if a gene has two alleles, “A” and “a,” “A” could represent the dominant allele and “a” could represent the recessive allele. You then draw a grid with two rows and two columns. The genotypes of the parent organisms are placed along the top and left side of the grid. The genotypes of the offspring are then determined by combining the alleles of the parent genotypes in each of the boxes in the grid.
Let's explore the Punnett square in more depth and provide a step-by-step guide on how to create and interpret one.
- Determine the genotypes of the parent organisms: Before creating a Punnett square, you need to know the genotypes of both parents. For instance, let's consider a cross between two pea plants, where the trait of interest is the seed color (yellow or green). One parent has a homozygous dominant genotype (AA) for yellow seeds, while the other has a homozygous recessive genotype (aa) for green seeds.
- Create the grid: Draw a grid with two rows and two columns. This creates four boxes within the square. If the organisms involved are diploid, the Punnett square will have four boxes. However, if they are haploid or if multiple genes are being considered, you may need to create a larger grid.
- Label the rows and columns: Write the alleles of the first parent's genotype along the top of the grid and the alleles of the second parent's genotype along the left side of the grid. In our example, the grid would have the “A” alleles along the top and the “a” alleles along the left side.
- Fill in the boxes: Combine the alleles from the top row with those from the left column in each box, resulting in the possible genotypes for the offspring. In our example, all four boxes would have the “Aa” genotype since each box combines one “A” allele from the first parent with one “a” allele from the second parent.
- Determine the genotypic ratio: Calculate the ratio of the different genotypes among the offspring. In our example, the genotypic ratio would be 100
- Determine the phenotypic ratio: Based on the offspring's genotypes, predict their phenotypes. In our example, since the “A” allele is dominant for yellow seeds, all “Aa” offspring will have yellow seeds. The phenotypic ratio would be 100
- Analyze the results: Interpret the results of the Punnett square and draw conclusions about the inheritance patterns and outcomes of the cross. In this case, the cross between a homozygous dominant (AA) and homozygous recessive (aa) parent results in offspring that are all heterozygous (Aa) and have the dominant phenotype (yellow seeds).
Understanding how to create and interpret Punnett squares is essential for predicting the genotypic and phenotypic outcomes of genetic crosses. This skill is valuable for solving genetics problems on exams like the IMAT, as well as for understanding inheritance patterns in real-life scenarios.
Calculating the Phenotypic and Genotypic Ratios
When using a Punnett square, you can derive several ratios, such as genotypic and phenotypic ratios, which are helpful for understanding the outcomes of a genetic cross. Here's a step-by-step explanation of how to calculate these ratios:
- Complete the Punnett square: First, create a Punnett square as previously described, filling in the possible offspring genotypes based on the parents' genotypes.
- Count the different genotypes: After completing the Punnett square, identify the unique genotypes of the offspring and count their occurrences. For example, consider a cross between two heterozygous parents with the genotypes Aa (where “A” is the dominant allele and “a” is the recessive allele).
In this case, the offspring genotypes are AA, Aa, and aa.
Calculate the genotypic ratio: To calculate the genotypic ratio, express the number of occurrences of each genotype as a ratio. Using our example above, the genotypic ratio would be:
- AA: 1 (1/4 or 25
- Aa: 2 (2/4 or 50
- aa: 1 (1/4 or 25
The genotypic ratio is 1:2:1 (AA:Aa:aa).
- Determine the phenotypes: Based on the offspring genotypes, predict the phenotypes of the offspring. In our example, since the “A” allele is dominant, the offspring with the AA or Aa genotype will exhibit the dominant phenotype, while the offspring with the aa genotype will exhibit the recessive phenotype.
- Calculate the phenotypic ratio: To calculate the phenotypic ratio, express the number of occurrences of each phenotype as a ratio. Using our example, the phenotypic ratio would be:
- Dominant phenotype (AA or Aa): 3 (3/4 or 75
- Recessive phenotype (aa): 1 (1/4 or 25
The phenotypic ratio is 3:1 (dominant:recessive).
By calculating genotypic and phenotypic ratios using Punnett squares, you can easily predict the outcomes of genetic crosses and understand the distribution of traits among offspring. This skill is essential for solving genetics problems on exams and in real-life applications.
Different Types of Genetic Crosses
Punnett squares can be used to analyze different types of genetic crosses, including monohybrid crosses, dihybrid crosses, and more. Here's a detailed explanation of each type:
Monohybrid cross: A monohybrid cross involves a single trait controlled by one gene with two alleles. In this type of cross, you're examining the inheritance pattern of one characteristic, such as eye color or flower color. The Punnett square for a monohybrid cross is a 2x2 grid, as there are two possible alleles for each parent. The genotypic and phenotypic ratios can then be calculated from the resulting offspring genotypes.
Example: A cross between two heterozygous pea plants with purple flowers (Pp) would be a monohybrid cross.
The genotypic ratio would be 1:2:1 (PP:Pp:pp), and the phenotypic ratio would be 3:1 (purple:white).
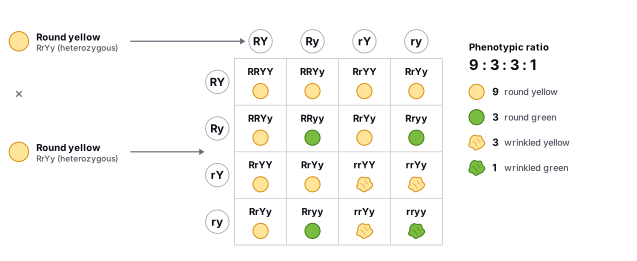
Dihybrid cross: A dihybrid cross involves two traits, each controlled by a different gene with two alleles. In this type of cross, you're examining the inheritance patterns of two characteristics simultaneously, such as seed shape and seed color. The Punnett square for a dihybrid cross is a 4x4 grid, as there are four possible combinations of alleles for each parent. The resulting offspring genotypes can then be used to calculate the genotypic and phenotypic ratios for both traits.
Example: A cross between two heterozygous pea plants with round yellow seeds (RrYy) would be a dihybrid cross.
The genotypic ratio for this cross would be 1:2:1:2:4:2:1:2:1 (RRYY:RRYy:RRyy:RrYY:RrYy:Rryy:rrYY:rrYy:rryy), and the phenotypic ratio would be 9:3:3:1 (round yellow: round green: wrinkled yellow: wrinkled green).
Find it in the figure
Coming soon for figure 8.2
Other types of crosses: Punnett squares can also be used to analyze more complex crosses involving multiple genes, incomplete dominance, co-dominance, or sex-linked traits. The size of the Punnett square will vary depending on the number of alleles and genes involved. As the number of traits and alleles increases, the Punnett square becomes larger and more complex, making it more challenging to calculate genotypic and phenotypic ratios.
In summary, Punnett squares are valuable tools for analyzing various types of genetic crosses, including monohybrid and dihybrid crosses. By using these tools, you can predict the possible offspring genotypes and phenotypes and better understand the inheritance patterns of different traits.
Section 8.4
Genetic Pedigrees
A genetic pedigree is a visual representation of the inherited characteristics of a particular family or group of individuals. It is commonly used to track inherited traits and conditions, such as genetic diseases or predispositions to certain health conditions. Genetic pedigrees are often used in medical and scientific research to understand the genetic basis of inherited traits and conditions, and to identify potential genetic risk factors for certain health problems.
To read a genetic pedigree, you will need to understand a few basic symbols and conventions. These symbols and conventions are used to represent the relationships between individuals in the pedigree and the inheritance of certain traits or conditions.
Here are some of the common symbols and conventions used in genetic pedigrees:
A square shape is used to represent a male individual. A circle shape is used to represent a female individual. A horizontal line connecting two individuals represents a marriage or partnership. A vertical line connecting an individual to their offspring represents a parent-child relationship. A filled-in symbol represents an individual who has the trait or condition being studied. An open symbol represents an individual who does not have the trait or condition being studied. To read a genetic pedigree, start by identifying the individuals at the top of the chart. These individuals are the founders of the pedigree, and their traits and conditions are traced down through the generations. Look for patterns of inheritance, such as if the trait or condition is present in every generation or if it skips a generation. You can also look for relationships between individuals, such as if the trait or condition is more commonly found in one gender or if it is inherited from a specific parent.
Tricks
There are a few general patterns that can help you determine the mode of inheritance when reading a genetic pedigree. Here are a few tips that may be useful:
Autosomal dominant inheritance: If a trait or condition is present in every generation and appears to be inherited from one parent, it is likely to be inherited in an autosomal dominant manner.
Autosomal recessive inheritance: If a trait or condition appears to skip generations and is equal in amount in both females and males, it is likely to be inherited in an autosomal recessive manner.
X-linked inheritance: If a trait or condition is more commonly found in males and appears to be inherited from the mother, it is likely to be inherited in an X-linked manner.
Mitochondrial inheritance: If a trait or condition is present in every generation and appears to be inherited exclusively from the mother, it is likely to be inherited in a mitochondrial manner. Every individual will be affected if the mother has a mitochondrial disease as the mitochondria is inherited (For the IMAT) by the mother's egg.
It is also important to note that some traits and conditions may be inherited in a more complex manner, such as through multiple genes or through a combination of genetic and environmental factors. In these cases, it may be more difficult to determine the mode of inheritance based on the pattern of inheritance alone. Luckily, it is out of the scope of the IMAT to know those.